CA$2,974/mo
Email revenue
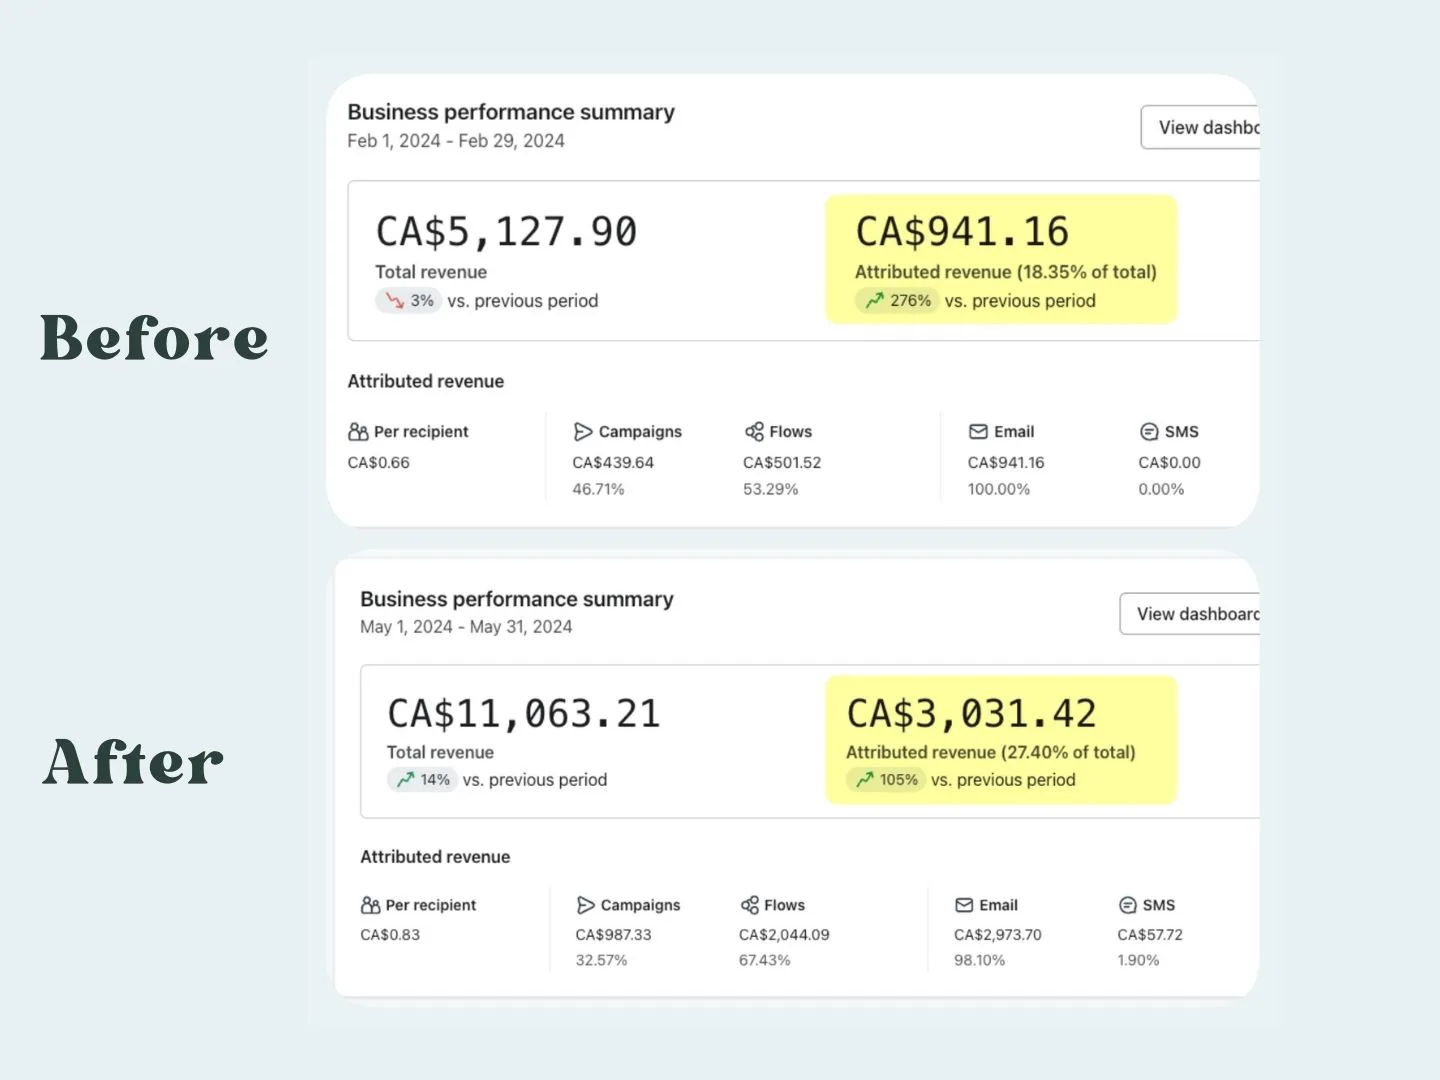
The published dashboard shows CA$941.16 in email-attributed revenue in February 2024 and CA$2,973.70 in May 2024. The May total of CA$3,031.42 includes SMS; read the channel breakdown and measurement limits.
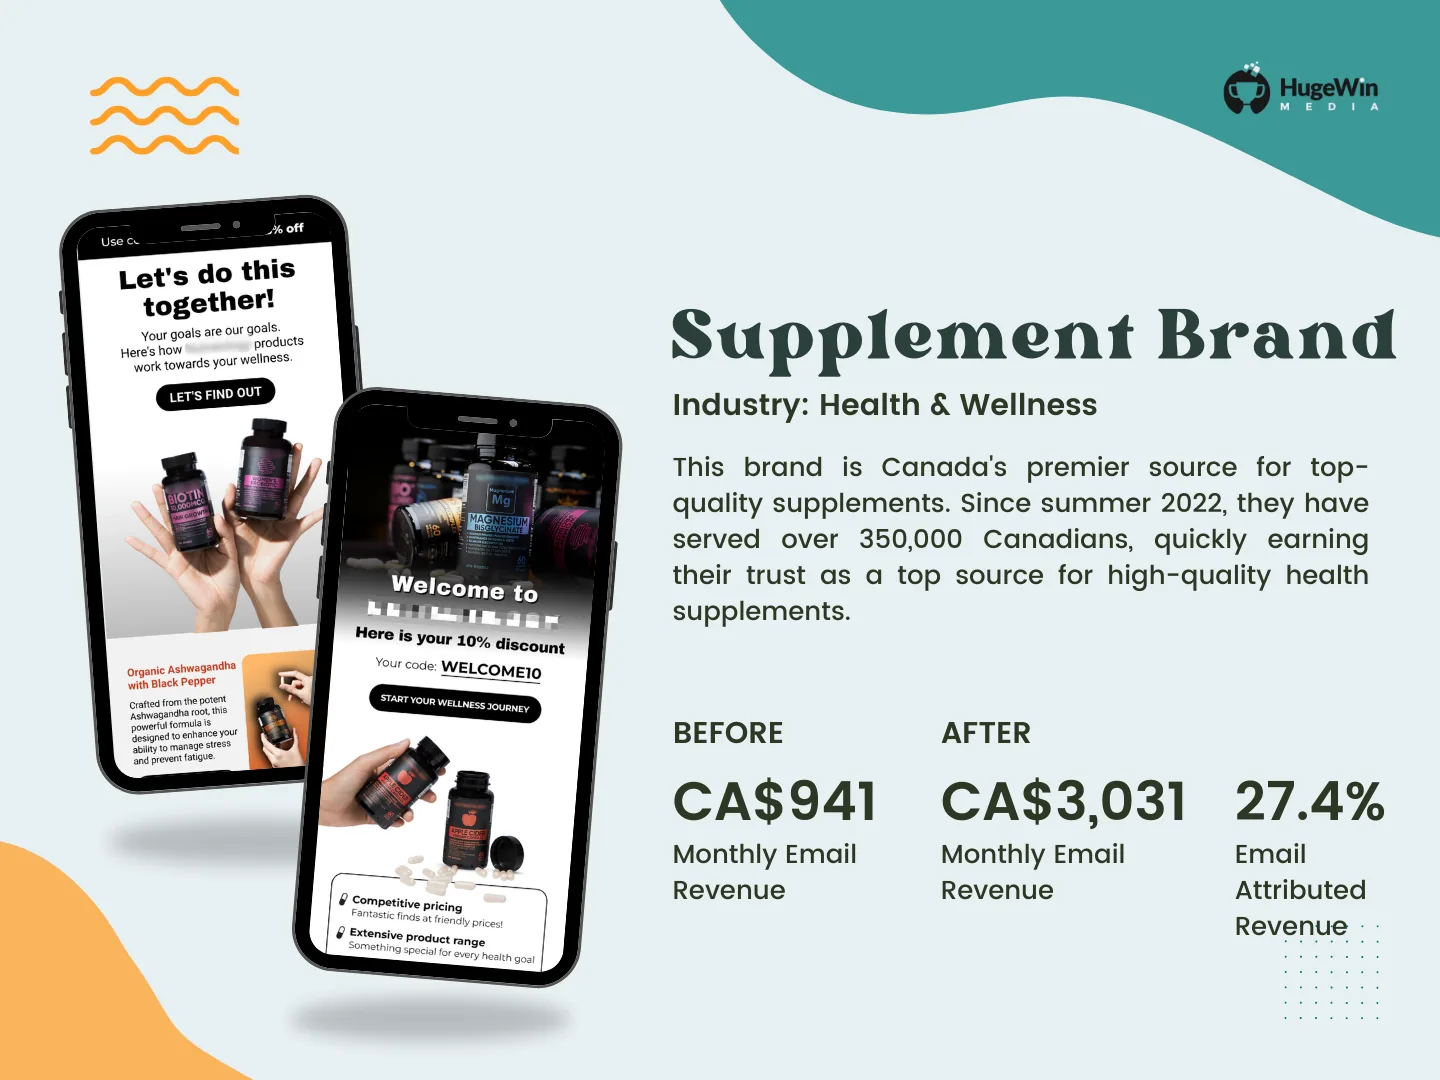
A Canadian supplement retailer that has served 350,000+ Canadians since summer 2022.
February 1 to 29, 2024: CA$941.16 email-attributed revenue and CA$0.00 SMS-attributed revenue, against CA$5,127.90 total store revenue.
May 1 to 31, 2024: CA$2,973.70 email-attributed revenue plus CA$57.72 SMS-attributed revenue. Their CA$3,031.42 total is 27.40% of CA$11,063.21 store revenue.
The May flow total of CA$2,044.09 and campaign total of CA$987.33 cover both displayed channels. They should not be described as email-only totals.
The original overview includes email examples. It does not provide a detailed implementation log, so this case does not assign the change to a particular flow, segment or campaign count.
| Dashboard measure | February 1–29, 2024 | May 1–31, 2024 |
|---|---|---|
| Total store revenue | CA$5,127.90 | CA$11,063.21 |
| Email-attributed revenue | CA$941.16 | CA$2,973.70 |
| SMS-attributed revenue | CA$0.00 | CA$57.72 |
| Email + SMS attributed revenue | CA$941.16 | CA$3,031.42 |
| Email + SMS attributed share of store revenue | 18.35% | 27.40% |
| Flows, all displayed channels combined | CA$501.52 | CA$2,044.09 |
| Campaigns, all displayed channels combined | CA$439.64 | CA$987.33 |
The headline rounds the email row to the nearest Canadian dollar. The May total of CA$3,031.42 includes SMS; 27.40% is the combined attributed share, not email alone. Flow and campaign totals also include both displayed channels.
The dashboard compares a February of 29 days with a May of 31 days. It does not establish a daily-normalized comparison, a continuous growth trend or incremental lift caused by HWM.
Attribution settings, margins, promotions and a detailed implementation log are not disclosed in these slides. We have not filled those gaps with assumed flow names or campaign counts.
For a wider comparison, see how to read agency metrics and the agency evaluation worksheet.